Heart Disease Mortality by County
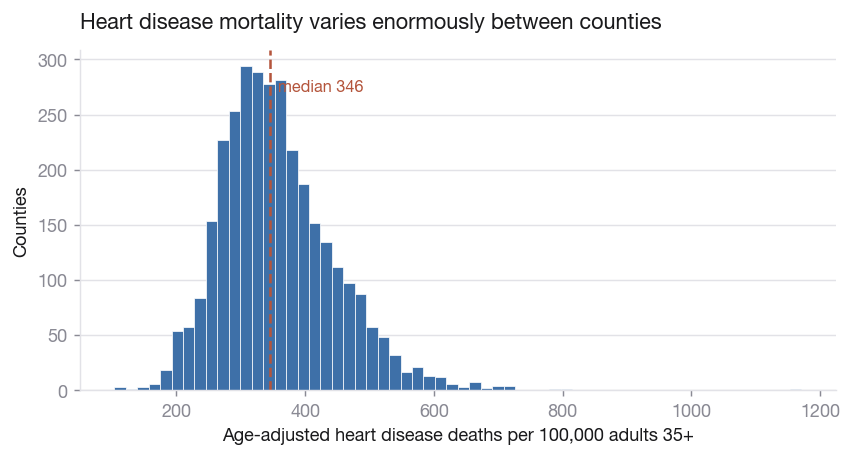
A county-level analysis of age-adjusted heart disease mortality among adults aged 35 and over, across 59,076 CDC records. Rates range from 104 to 1,170 deaths per 100,000, an 11.3-fold difference that survives the removal of both tails.
I built this as practice in scraping and analysing public data, so it should be read as a skills exercise. The findings summarise what is already present in the source dataset.
Question
Heart disease mortality is normally reported at national level, which conceals how unevenly it falls. The CDC publishes age-adjusted rates by county, so the spread between counties can be measured directly, and because the rates are age-adjusted, differences in the age structure of each population are removed before any comparison is made.
The analysis maps that rate onto every county the CDC reports on, then examines the shape of the distribution, its geographic clustering, and its stratification by sex and race.
Results
- The highest-mortality county, Franklin Parish, Louisiana at 1,170 per 100,000, runs 11.3 times the rate of the lowest, Pitkin County, Colorado at 104.
- Trimming both tails leaves the 95th percentile at 2.2 times the 5th, so the spread is not produced by a handful of extreme counties.
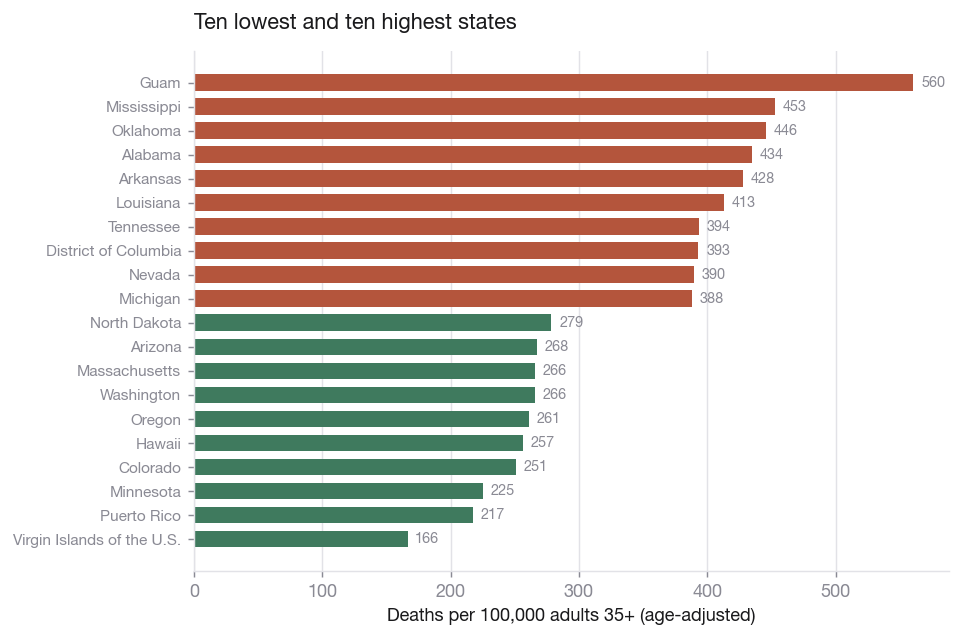
- The highest-mortality counties cluster through the Mississippi Delta and Appalachia, across Louisiana, Mississippi, Arkansas, Kentucky and Alabama.
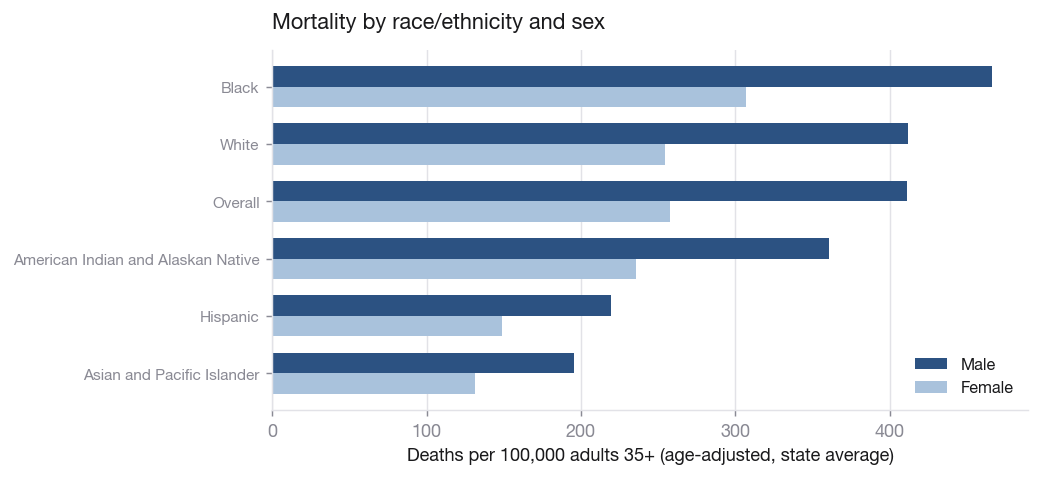
- Black adults carry the highest rates of any group at 466 per 100,000 for men and 307 for women, some 2.4 times the rate for Asian and Pacific Islander adults at 196 and 131.
- Men die at roughly 1.5 times the rate of women within every group.
Interpretation
- A range that narrows only to 2.2-fold after both tails are trimmed indicates a distribution shaped by systematic differences between places, since noise at the extremes would not survive trimming.
- Since age has already been adjusted for, the remaining variation is attributable to modifiable factors such as risk-factor prevalence, access to care and treatment quality, which places the finding within the reach of public health intervention.
- The clustering through the Delta and Appalachia suggests that geographically targeted intervention would reach a disproportionate share of the burden, although disparities by sex and race persist within every stratum, so geography alone would not close the gap.
Figures
Method and limitations
The dataset carries both stratified rows and “Overall” totals, and mixing the two double-counts every county, so the geographic analysis uses only the all-sex, all-race rows while the disparity analysis uses only the stratified ones. Age-adjustment is what makes the comparison meaningful, since a county with an older population would otherwise appear lethal on the strength of its age structure alone. County-level rates are ecological measures and do not support inference about individuals.